
Chamberí · Salamanca
The two districts people weigh most when they want central Madrid without living in the old centre.
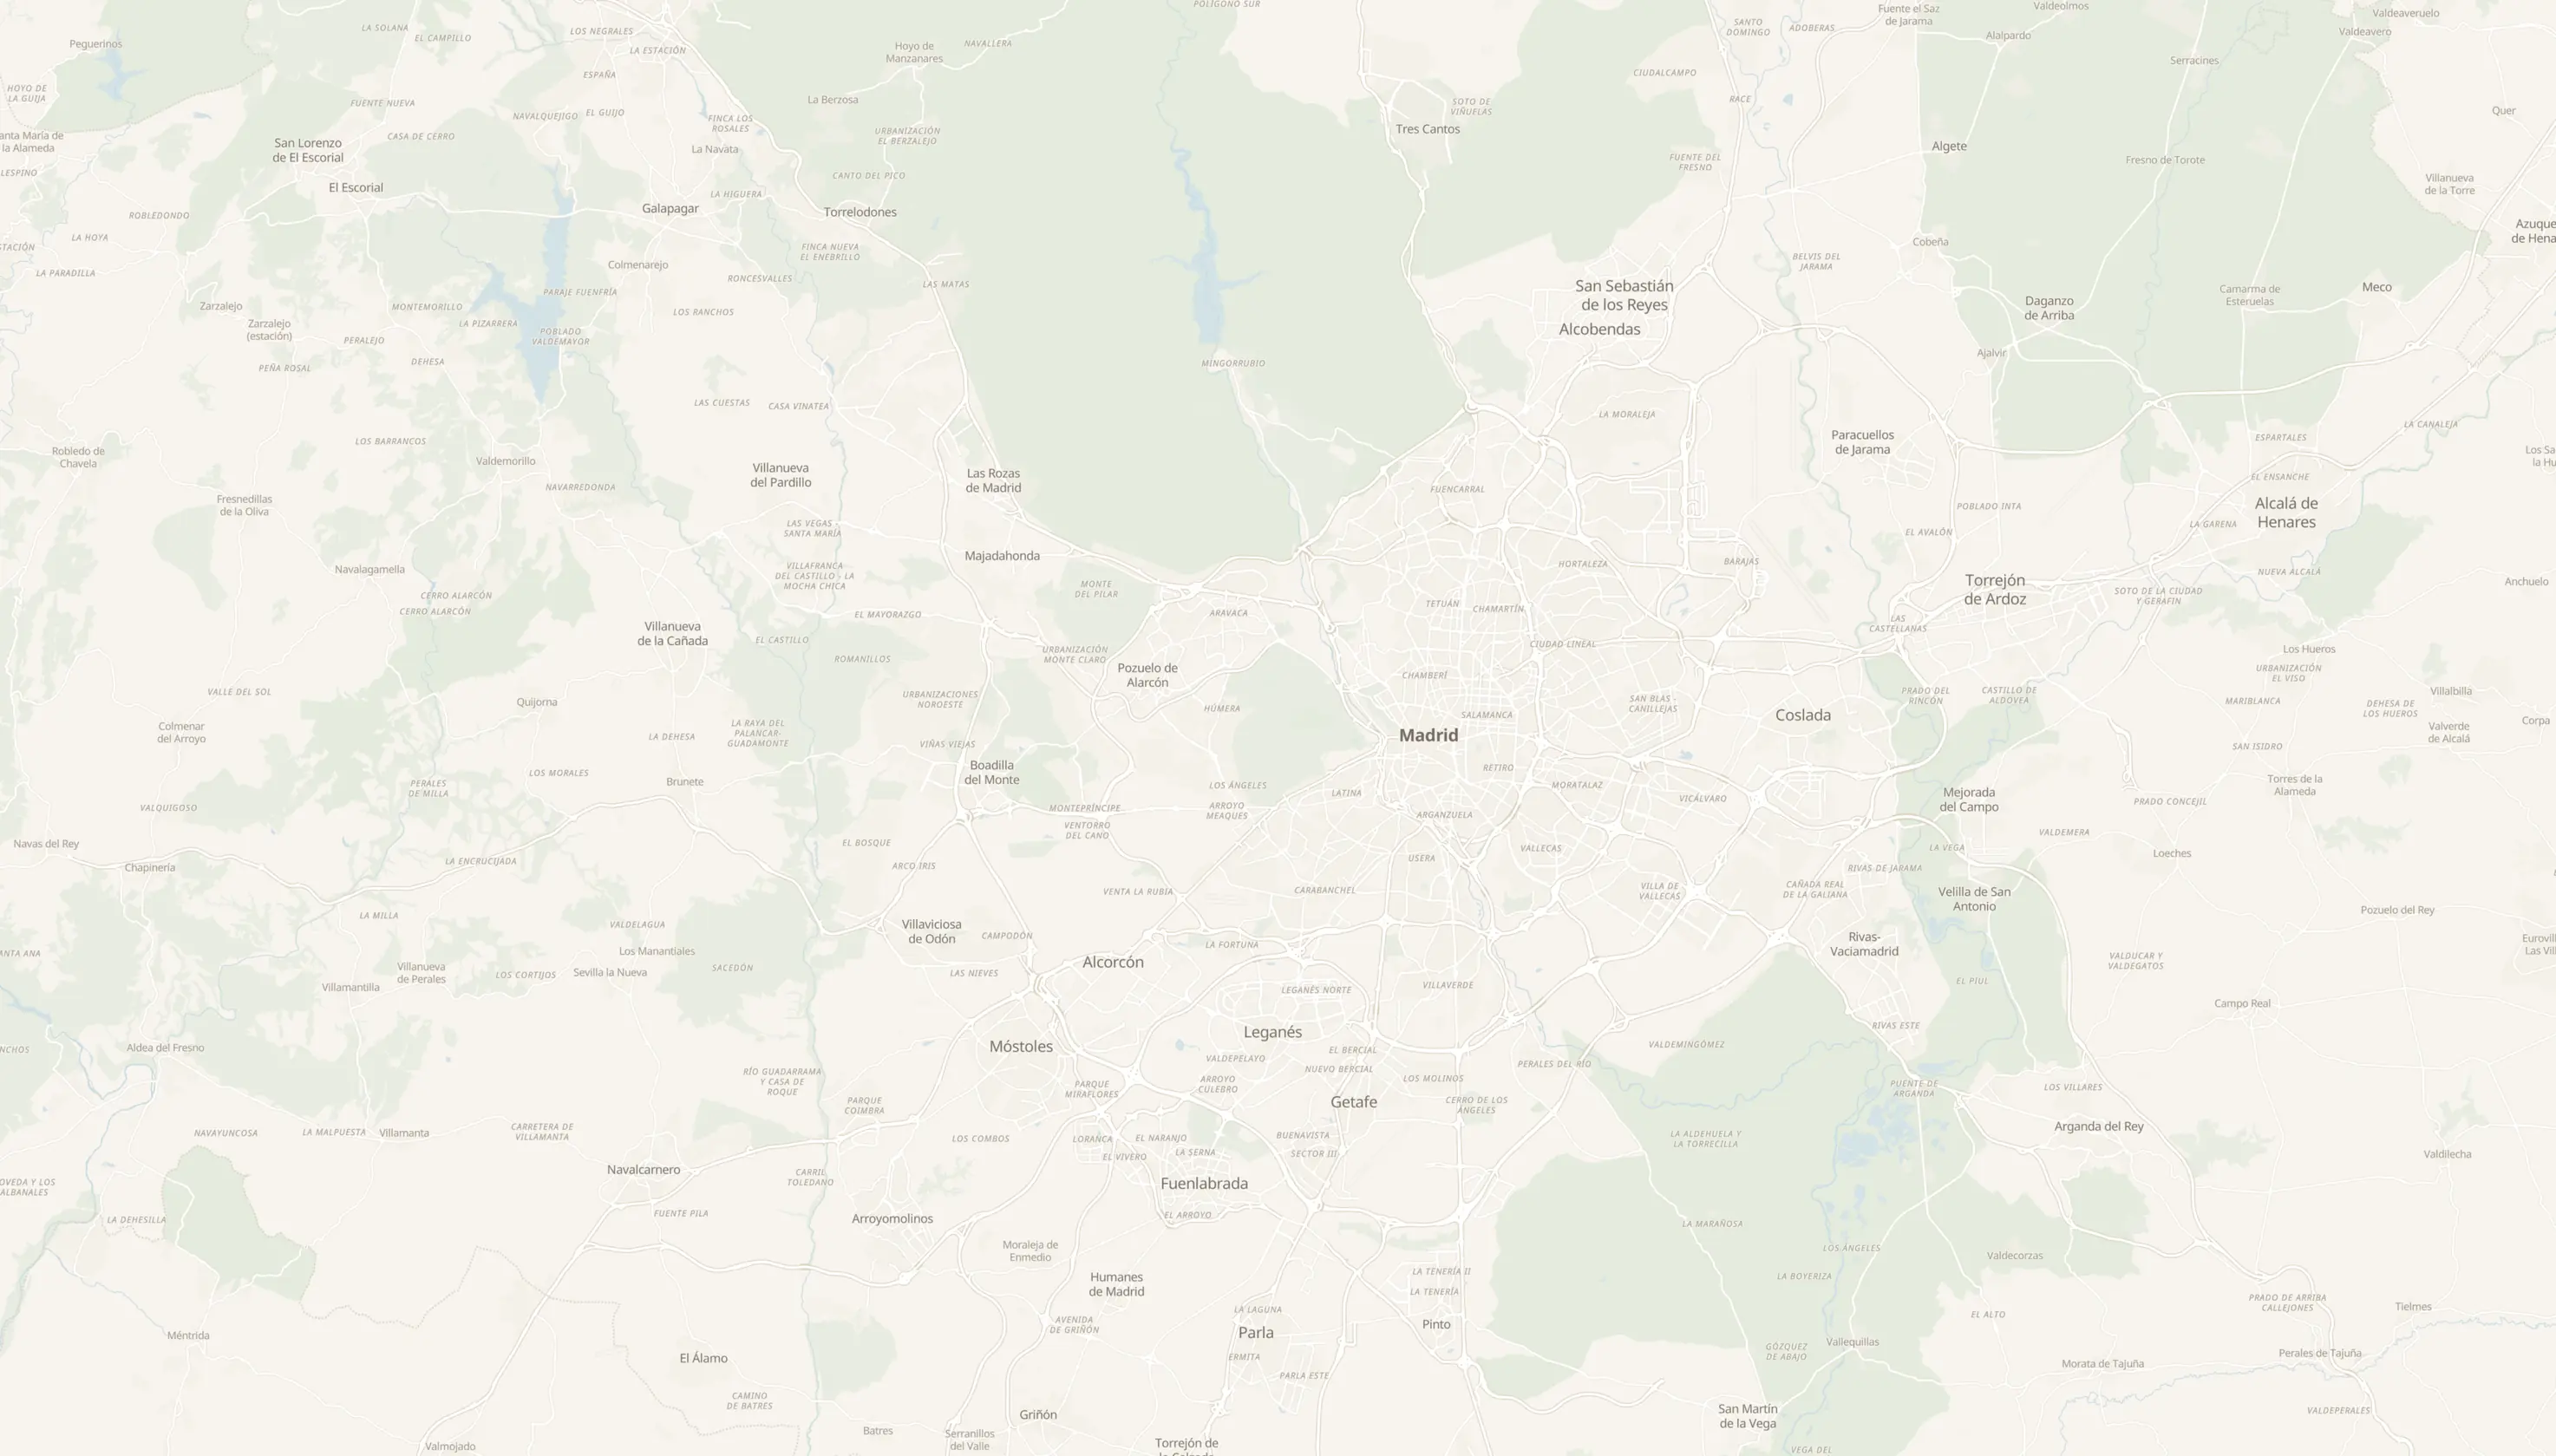
Pick two areas of Madrid or its suburbs and set them next to each other on the map: what it costs to live in each, how you get around and what is within a short walk.
Neighbours that compete with each other, and the usual two or three alternatives for the same kind of life.
The two districts people weigh most when they want central Madrid without living in the old centre.
Neighbours on either side of the park.
Living in the Madrid of the postcards, or right next to it.
The two classic choices for relocating families who want to stay inside the city.
Two stretches of the Castellana.
The two western towns most chosen by families with children in international schools.
Neighbours on the A-6, served by the same commuter line.
The west in two steps.
Houses with gardens on either side of a municipal boundary.
Madrid's two big villa areas, at opposite ends of the city.
The same municipality, two ways of living in it.
A house with a garden or a large flat without leaving Madrid.
Newer homes in the north, on either side of the city limit.
The two options for anyone working in the northern business parks.
The north outside the city, along the A-1 or the M-607.
The two districts across the Manzanares that have changed most without stopping being affordable.
Neighbours in the south-west of the city.
Two of the most affordable rents inside the city of Madrid, either side of the A-4.
South-east against south-west.
Wall to wall, with a price gap you can feel.
Two ways to stay inside the city without paying central prices.
The east of the city in two neighbouring districts.
Eastern neighbours with rents below the city average.
The south of the city in two steps.
The two southern towns with a Carlos III campus, metro and commuter rail.
South-western neighbours on the same commuter line.
Two southern towns joined by MetroSur and set apart by how they connect to Madrid: Alcorcón looks west along the C5; Leganés looks south and to the centre.
Either side of the Madrid city limit, along the same southern corridor.
Newer homes in the south-east, inside and outside the city.
The eastern ring in two versions.
No scores. Each row shows each neighborhood's figure, measured the same way, and the better figure is marked in green.
The finder asks for your budget, where you go each week and how you travel, and returns the areas that fit you. The comparison asks nothing: you already have two neighborhoods in mind and want to see them side by side. If neither convinces you, the finder is the next step.
Because that is what can be stated honestly on a page that stays published. The index compares the price per square metre of real contracts in each area with the city of Madrid, which is 100. Actual euros for your kind of home come from the finder, with their margin.
From the centre of each area: the point inside its shape with the most shops, bars, gyms and schools within a kilometre. Not the station, because in many towns the station sits on the edge. The map draws that circle and exactly the points that are counted.
No. They come from the official Metro, Light Rail and Cercanías timetables, from each area's reference station, arriving before 9:00 on a weekday. When there is no reasonable way to get there without a bus, it says so instead of making one up.
Yes, any pair of the 29 areas that have a guide on BestBarrio, in the city of Madrid and around it.
Tell us your budget and the places you go each week, and we will show you the areas that fit you, including the ones you had not considered.